On the other hand
Internet home of C. Susannah Tysor
Jeremy Fox and Brian McGill answer a question of mine over at Dynamic Ecology.
What jobs outside of academia are eco-evo PhDs best qualified for? If you quit your academic scientist job, what would you do next?
Off the tenure-track
Joining the National Phenology Network to help me with my PhD
As part of my PhD, I want to predict when lodgepole pine releases pollen and when its seed cones are receptive across as much of the species range as I can. I’m using data collected in seed orchards (thanks Joe Webber, Chris Walsh, Rita Wagner, and the countless people who were part of building these data sets) to build a model, and I’d like to use citizen science data from the National Phenology Network to test my model.
Right now, the dataset for lodgepole pine from NPN has observations for 28 individuals at 6 sites over about 2 months in 2 years. I’d like more sites, more individuals, and more years to test my model against. I’m going to be tracking down as many lodgepole pine populations as I can around Vancouver and keeping track of them in my own Nature’s Notebook.
You could help!
NPN has pretty fantastic data sets from a lot of awesome volunteers. You can be awesome, too: pick your favorite species and start collecting data! It will make you look really important when you’re out hiking and provides a great excuse for that time your neighbor catches you in their yard right next to their lovely camellias.
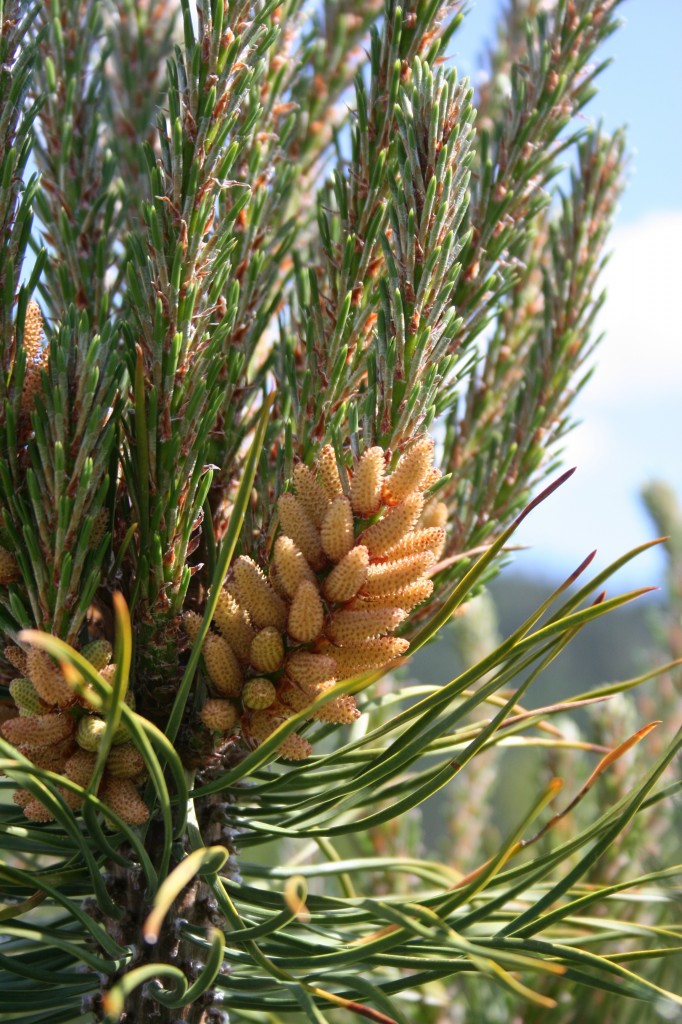
Of course, I hope all you western North Americans choose to start collecting data on lodgepole pine. How could you resist these lovely little pollen cones?
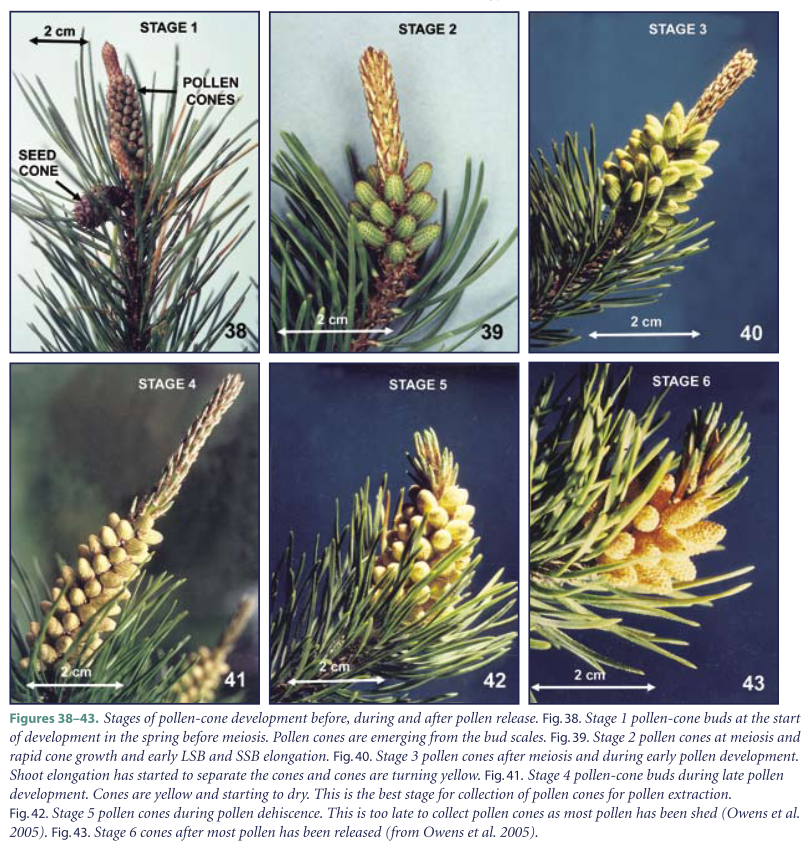
If you’ve never had a close look at pollen cones, here are some nice pictures summarizing the stages the cones go through from a report by John Owens:1
If you give me a year and a location, I want to be able to tell you when stages 3 and 4 happened. Stay tuned for results!
1. Owens JN: The Reproductive Biology of Lodgepole Pine. Forest Genetics Council of British Columbia; 2006.
Automating digitizing your data
Last month I asked for advice on automating a huge bunch of data transcription. At that point, my knowledge of OCR was that OCR exists. Now I’ve learned enough to know that OCR won’t solve my data transcription woes.1 The forms my data are entered on differ from year to year and sometimes even site to site. The forms are a mixture of handwritten and printed information and printed parts are often modified by hand. I didn’t find anything I could use out of the box or that looked easy for me to modify to digitize my data. If I’d had 10 or 100 times the data I do, it may have been worth it to work harder to develop an automated solution. In the meantime, my supervisor hired an undergraduate to help me.
If you’re in a similar boat, but your supervisor is less awesome, you may want to consider Mechanical Turk or inviting your hipster friends to super underground data transcription parties.
1 Thanks @davidjayharris for pointing me in the right direction!


