Pinus contorta distribution map in #rstats

I made a map in R for the first time last week using these guides by Kim Gilbert and Mollie Taylor.
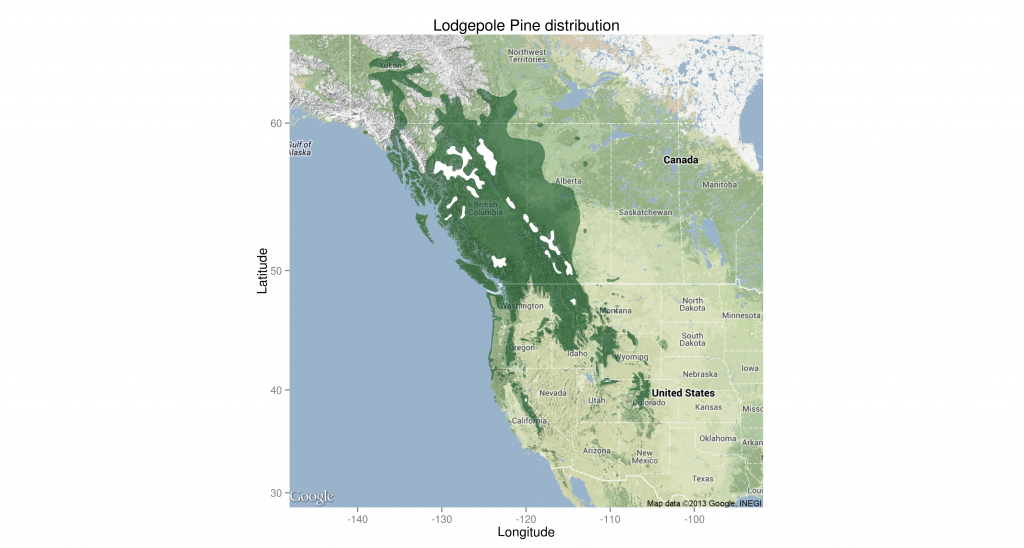
Pinus contorta range map including all subspecies. White areas within the distribution boundary contain no lodgepole. Based on Little 1971.

Pinus contorta range map including all subspecies. White areas within the distribution boundary contain no lodgepole. Based on Little 1971.

As you can see, I wasn’t able to show the holes in the distribution properly. Ideally, they would be actual holes showing the base map. I couldn’t get geom_map to not fill in the holes, so I overfilled them with white.

The code for the map is below and the shapefile I used is from the USGS GECSC Tree Species Distribution Maps for North America.

If anyone’s got a shapefile for just subspecies latifolia or a more recent distribution map, I’d love to use it.

pcontorta <- readShapePoly("pinucont.shp")
colors <- brewer.pal(9, "BuGn") # make pretty color palette

basemap <- get_map(location = c(lon = -120, lat= 50), #build basemap of Western North America
  color = 'color',
  source = 'google',
  maptype = 'terrain',
  zoom = 4)
basemap <- ggmap(basemap)

pcontorta.points <- fortify(pcontorta) 

lodgepole <- geom_map(inherit.aes = FALSE, #make a layer for the lodgepole distribution
  aes(map_id=id),
  data=pcontorta.points,
  map=pcontorta.points,
  fill = colors[9],
  alpha = .5 )

holes <- geom_map(inherit.aes = FALSE, #fill the holes with white
  aes(map_id=id),
  data = pcontorta.points[which(pcontorta.points$hole==TRUE),],
  map=pcontorta.points[which(pcontorta.points$hole==TRUE),],
  fill = "#FFFFFF",
  alpha = 1 )

basemap + lodgepole + holes + #put it all together
xlab("Longitude") + ylab("Latitude") +
ggtitle("Lodgepole Pine distribution") 
 
Tagged ,

Forests on thawing permafrost: fragmentation, edge effects, and net forest loss

Picea mariana forests are disappearing into peat bogs.

Baltzer JL, Veness T, Chasmer LE, Sniderhan AE, Quinton WL: Forests on thawing permafrost: fragmentation, edge effects, and net forest loss. Global Change Biology 2013, doi:10.1111/gcb.12349.

It is often assumed that forcing [for budburst] does not begin until after the chilling requirement has been met and this undoubtedly is what occurs naturally in boreal regions where extended periods of cold temperatures are never or rarely interrupted by warmer (forcing temperatures) until spring. We believe, however, that chilling and forcing can occur at the same time (in the temperature range where they overlap) and both systems are accumulating ‘‘time’’ over the dormant period. The systems involved in such accumulations (named the ‘‘memory of winter’’ by Amasino, 2004) are not understood.

From Harrington CA, Gould PJ, St.Clair JB: Modeling the effects of winter environment on dormancy release of Douglas-fir. Forest Ecology and Management 2010, 259:798–808.

The memory of winter

Inertia toward continued emissions creates potential 21st-century global warming that is comparable in magnitude to that of the largest global changes in the past 65 million years but is orders of magnitude more rapid.

From Diffenbaugh & Field 2013 in Science

Sentences to make your blood run cold